Modeling Impression Discounting in Large-scale Recommender Systems
Paper link here
Impression Discounting Introduction
Usually a Recommender system generates a list of items that are sorted based on a score, which is shown to the users. An item is impressed if the user has seen the recommendation. Acceptance of the recommended item by the user (usually in the form of a click) results in conversion. In the Impression Discounting Problem, the goal is to maximise the conversion by taking into account the user’s past behavior to the items generated by the recommender system.
Here’s the intuition behind this. Consider the case of Netflix - which is a movie recommender system. It is recommending me to watch the movie Zootopia. I ignored the recommendation the first 8 times I saw it. Can the recommender system take this into consideration while generating the score for Zootopia, the 9th time I login to Netflix? In this example, I’ve used the Number of Impressions as one of the features/behaviors.
The paper analyzes various features and how their correlation to Impression Discounting. It also provides an Impression Discounting Framework that is applied to a Large Recommender System in Production.
Formalizing Impressions
An Impression in the recommender system is modeled as a tuple T with six attributes:
T = (user, item, conversion, [behavior1, behavior2, …], t, R)
where:
- user is the user ID;
- item is a recommendation item ID;
- conversion is a boolean type to describe whether or not user took an action on item in this impression;
- behavior is an observed feature of interaction;
- t is the time stamp of impression;
- R is the recommendation score of item to user, which is provided by the recommendation engine.
Some of the other features or behaviors mentioned in the paper are -
-
LastSeen - the day difference between the last impression and current impression, associated with the same (user, item);
-
ImpCount - the number of historical impressions before the current impression, associated with the same (user, item);
-
Position - the offset of item in the recommendation list of user.
-
UserFreq - the interaction frequency of user in the recommender system.
Impression Discounting Framework
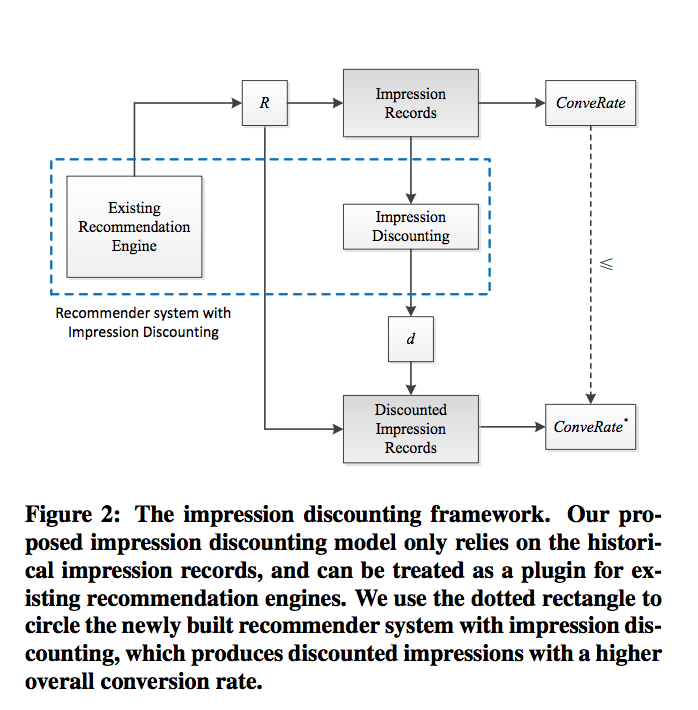
The paper discusses a plugin-type framework - an impression discounting plugin that can be plugged to any existing recommendation system. The plugin approach does not change the existing recommendation model, and the impression discounting is performed by multiplying a discounting coefficient d with the recommendation score. The Impression Discounting Infrastructure, uses the past impression of the user on the recommended items to calculate the discounting factor d and applies this to the impression to form discounted impressions.
Aggregated Discount Model
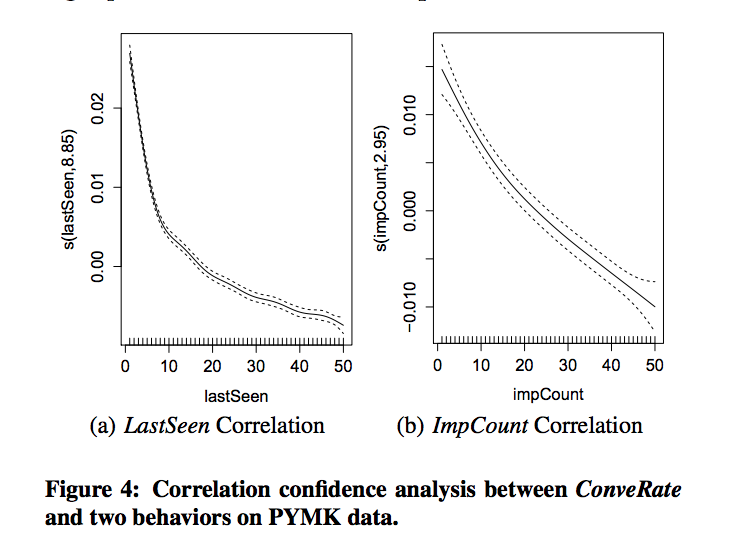
Regarding the modeling aspect, the first stage is Correlation Analysis. For each of the behavior, we can plot a correlation curve like the one below. The paper introduces four different discounting functions (linear, inverse, exponential and quadratic) for curve fitting to get the optimal discounting model.
Aggregation - When you combine multiple behaviors (for example, “last seen” and “impression count”), where each behavior has been analysed and been fitted to an appropriate discounting function, we can then use standard regression techniques to combine them.
Anti-Noise Regression
In order to detect noise or outliers in the above regression problem, the paper discusses a density based approach to form 3 kinds of observations - core observations, border observations and outlier observations. This could further be used in a density weighted linear regression.

Kaushik Rangadurai
Code. Learn. Explore